
Virtualware · Initiation · 22 June 2026
Virtualware
HIGHLIGHTS
Virtualware is a small, XR platform with enterprise traction and high gross margins. Net turnover was €4.55m (2023), €4.20m (2024), and €4.32m (2025). Reported gross margins sit in the high 80%s, and could be higher going forward. The model is perhaps still sub scale, but the unit economics read well - low COGS, capitalised development, and a mix that is moving toward platform licences and subscriptions. We believe the company wins by becoming irreplaceable in installed customers, not by capturing greenfield share at scale
Enterprise XR training and industrial simulation are now budgeted line items at large organisations. Virtualware's edge is being European, and product led in a space that is often project focused. One or two large wins will move the company onto tech investors radars. A single multi year framework agreement can change the P&L profile, and lift the market cap.
Pre-2021, Virtualware was a bespoke VR project shop, each engagement was a custom “Statement of Work”. Revenue was lumpy, gross margin was 70% and operating leverage was limited. The 2021 strategic plan launched VIROO as a platform product sold under a recurring annual subscription, with services as a bolt-on. As a result the gross margin has risen to 80-90% and the 19% EBITDA margin in 2024 demonstrated that the cost structure is capable of operating leverage. We expect EBITDA margins to rise further from here.
We see a number of catalysts 1) Shift in the revenue mix - platform rises from ~45% of revenue toward 52% in 2026 and 60% in 2027, visibility improves and gross margin stays structurally high. 2) Improved disclosure - consistent segment and geography disclousure, will support credibility and re rating. 3) Simumatik upsell. Bundling simulation with training increases ARPU and raises switching costs. Initiate with a BUY target price Euro 7.42 p.s.
| Year to 31 Dec | 25A | 26E | 27E | 28E | 29E |
|---|---|---|---|---|---|
| Revenue (Euro Mil) | 4.32 | 6.02 | 7.14 | 7.78 | 8.46 |
| Net profit (Euro Mil) | -0.26 | 0.58 | 1.30 | 1.57 | 1.90 |
| EPS (Euro) | -0.06 | 0.13 | 0.29 | 0.34 | 0.42 |
| EPS (% YoY) | -148% | 321% | 123% | 20% | 21% |
| PEx (@ 5.65) | -97.0 | 43.9 | 19.7 | 16.4 | 13.5 |
| ROE (%) | -12% | 21% | 32% | 28% | 25% |
| P/B(x) | 1.88 | 2.54 | 2.24 | 2.00 | 1.76 |
| Net debt to equity (%) | 122% | 41% | 2% | -21% | -37% |
01Small high margin business about to scale+
Virtualware is a developer of industrial virtual reality platforms serving nuclear, medical, educational, and defence clients. Founded in 2004 and headquartered in Basauri, Spain, the company focuses on enterprise-grade VR training, simulation, and digital-twin environments. Its flagship platform, VIROO, is used for complex industrial training environments, and recent contract wins (e.g., an ~€0.8m extension with ADIF for railway VR training) indicate traction in regulated, mission-critical sectors
Virtualware serves global organizations and institutions including GE Vernova, Volvo, Alstom, ADIF, Bosch, Kessler Foundation, Invest Windsor Essex, McMaster University, the University of El Salvador, Ohio University, the Spanish Ministry of Defense or the Basque Government..
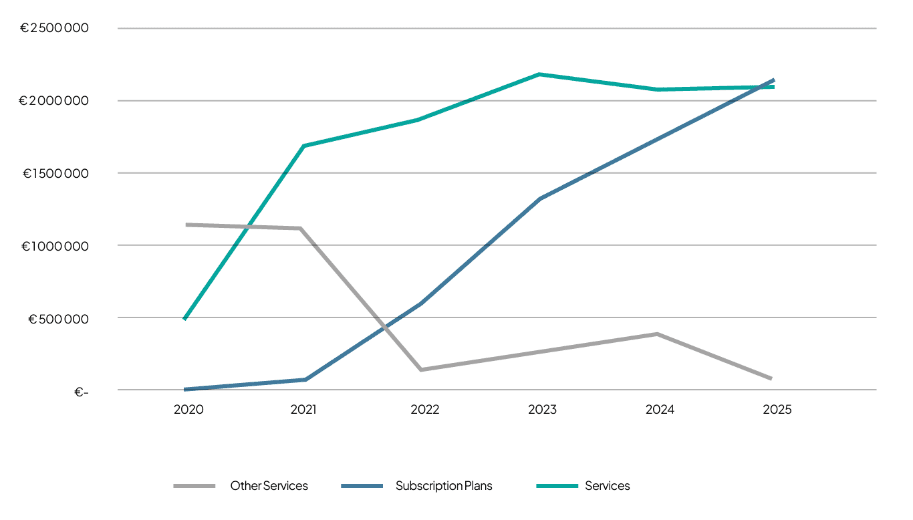
The company has successfully pivoted from a revenue model based on custom project development (Other Services) to a model based on recurring revenue from the sale of its own products and services associated with those products.
Virtualware has guided for approximately 30% organic revenue growth in 2026, targeting €5.7 to €6 million in revenue and an EBITDA margin of 20% to 25%, equivalent to approximately €1.2 million. Management has confirmed that approximately €4.0 million of the 2026 guidance midpoint was already contracted at the end of Q1 2026, representing approximately 69% revenue visibility at the mid year materially reducing execution risk relative to the headline growth target.
Virtualware's main products are VIROO, its enterprise XR platform, and Simumatik, its industrial emulation and digital twin platform — the two pillars of its real-time 3D software strategy.
Core Product — VIROO is infrastructure software — it sits between hardware (HTC VIVE, Meta Quest, PICO) and application logic (custom training modules, digital twins). Comparable in commercial pattern to enterprise platform plays like Unity Industrial, NVIDIA Omniverse Enterprise, or PTC Vuforia, but at a smaller scale and with a sharper focus on multi-user, sovereign / on-premise capable, enterprise-controlled deployments
- A VRaaS platform with subscription revenue.
- Multi-user, room-scale, cloud-enabled.
- Low-code content creation (Unity-based).
- Hardware-agnostic (HTC, PICO, Meta, CAVEs).
- ISO 27001 certified.
- Supports remote collaboration across geographies.
- Includes VIROO Rooms — patented tracking system (Nmerso).
- Includes VIROO Studio — content creation toolkit.
Virtualware is Iberia anchored but already diversified into Europe, North America and LATAM. The growth runway is in export markets, especially North America and industrial Europe.
The company expects North America to represent 50% to 60% of total revenues in the coming years, driven by continued investment in business development, strategic customers, and university partnerships across the United States and Canada.
02Customer base · mid-cap quality on micro-cap revenue+
The customer base — Virtualware's 120+ active organisations and 64 active VIROO rooms worldwide (per annual-report 2025) span six verticals. The named anchor customers are unusually concentrated for a €4M – 6M-revenue company in capital-intensive, long-cycle sectors — a strong signal of mid-cap-quality customer mix despite micro-cap revenue.
GE Vernova Hitachi (GVH) — 6+ year partnership; designated GVH global partner in immersive technology. BWR-X300 Small Modular Reactor digital twin completed at ATC2 facility December 2025; 4 VR simulators at NSB facility (latest July 2025 for PWR fuel handling). “Top-tier industrial clients Volvo and Gestamp” referenced as Simumatik users.
Spanish Ministry of Defense — SIMUR simulator (Military School of Health) since 2020.
NATO NMSG — active participation in working groups; David Moreno (Director of BD) presented at 2025 Annual Symposium in Warsaw on multi-domain XR.
TEDAE — joined September 2025 (Spanish Defense, Security, Aeronautics & Space Tech association — 100+ companies, €11.5B aggregate revenue).
Spanish Ministry of Education / Telefonica Educacion Digital — €5.7M / 6-year contract; 66 Centers of Excellence for Vocational Training. Likely funded under Spain Recovery and Resilience Plan / NextGenEU.
Basque Government — historical anchor (€1.5M contract for 12 vocational centres in 2023; ~€135k/yr in active operating subsidies).
VIROO University Grant Program with HTC VIVE — phase 1: UCLA, Illinois Tech, UNC Greensboro ($500k of tech infrastructure).
Ohio University Digital Enterprise Collaboratory (DEC) — Athens + Dayton DTC connected XR labs; Intel and Anduril ecosystem (Ohio = 17.5% of US manufacturing GDP).
University of Central Florida DEEPspace Lab (METIL Lab) — June 2025 launch, southern US flagship.
University of Lethbridge, McMaster, University of El Salvador — additional named deployments.
Nextstar Energy (Stellantis × LG Energy Solution gigafactory, Windsor ON) — Battery Boost program, $3.8M Canadian government funded, 400+ workers trained, 98% job placement rate.
Cádiz Advanced Manufacturing Center (CFA) at Navantia facilities (Andalusian regional infrastructure).
ADIF (Spanish railway infrastructure) — RITS framework collaboration; presented at UIC WCRT in China.
MAFEX member (Spanish railway industry association).
Osakidetza (Basque public health) — emergency triage training; 100+ real clinical cases; co-developed with BioBizkaia, Basurto/Cruces/Urduliz hospitals.
03Customer concentration risk & company timeline+
There is a customer concentration risk - The single largest customer relationship (Telefonica/MEFPD) generated ~€1M of receivables crystallising as ~€5.7M signed contract value over 6 years. As of 31 Dec 2025, this single receivable (€6.22M, collected 8 Jan 2026) was equivalent to ~144% of full-year 2025 revenue. Concentration is elevated by micro-cap standards but mitigated by: - Multi-year duration (revenue spread to ~2031) Counterparty quality (Telefonica group balance sheet behind it) - Public-sector funding likely tied to EU multi-year financial framework.
04Intellectual property sits at the listed company level …however, there are no active patents+
Intellectual property sits at the listed company level,
Intangible assets (industrial property) sit on the parent's balance sheet. Subsidiaries do not show capitalised patents. Simumatik's technology (Sweden AB) is treated as an acquired asset but the IP is consolidated centrally. No subsidiary carries patent amortisation or patent-related assets
….however, there are no active patents.
Our desk analysis shows that the company only had 1 patent that was filed in Spain in 2018 and granted on 25th July of that year but that patent appears to have lapsed on 26th August 2024. This appears to have impacted their related patents that were filed in other jurisdictions
| Publication | Recent event indicator | Category | Event description | Country | Event date |
|---|---|---|---|---|---|
| CA3064672A1 | CA EEER | D: Search and examination | EXAMINATION REQUEST | Canada | 17/12/2019 |
| CN110809748A | CN WW01 | B: Application discontinuation | INVENTION PATENT APPLICATION WITHDRAWN AFTER PUBLICATION | China | 23/6/2023 |
| EP3650996A1 | EP 18D | B: Application discontinuation | APPLICATION DEEMED TO BE WITHDRAWN | Europe | 22/5/2024 |
| ES2648643B2 | ES FD2A | H: IP right cessation | ANNOUNCEMENT OF LAPSE IN SPAIN | Spain | 26/8/2024 |
| WO2019008200A1 | EP ENP | A: Application filing | ENTRY INTO THE NATIONAL PHASE | WIPO | 7/2/2020 |
| MX2019014856A | No legal event data found | Mexico | |||
| US11169596B2 | US FP | H: IP right cessation | LAPSED DUE TO FAILURE TO PAY MAINTENANCE FEE | USA | 6/1/2026 |
Management has confirmed that all patents “have no commercial value at this time and do not provide any competitive advantage” and will be allowed to lapse. This does suggest that VIROO's competitive moat rests entirely on platform depth, switching costs, and customer relationships — not on registered IP protection.
05Sector is moving from experimental to essential+
The enterprise XR / VR training market is a sub-segment of the broader extended-reality industry, with multiple industry size estimates clustering around: - Global market 2025: ~$6-8B and CAGR through 2030: 25 - 35% - and projected 2030 size of $20-30B The growth driver is the substitution of physical training infrastructure with immersive simulation in regulated, high-cost, high-risk environments — energy, defense, healthcare, manufacturing
Enterprise XR training and industrial simulation is moving from experimental to essential, and the shift is happening fast. For years, VR and AR were treated as “nice-to-have” pilots inside innovation teams; now they sit inside operational budgets because the economics now make sense. Industrial firms have realised that immersive training cuts risk, compresses learning cycles, and standardises procedures in a way that classroom or video training can't. When a technician can rehearse a hazardous procedure a hundred times in a virtual environment before touching real equipment, the ROI is immediate mainly thrugh fewer accidents, fewer shutdowns, and a workforce that reaches competency faster. The hardware has matured, platforms have stabilised, and CIOs are now comfortable deploying XR across factories, utilities, logistics hubs, and energy infrastructure.
At the same time, industrial simulation has broken out of the engineering department and become a strategic capability. Digital twins, multi-user VR rooms, and real-time 3D simulation are now used for everything from plant commissioning to maintenance planning to operator training. The driver is simple: industries with complex assets and high compliance burdens need tools that reduce downtime and increase predictability. XR simulation does both. The sector is still developing with fragmented vendors, uneven standards, and a mix of platform and project-led players, but the direction of travel is clear. Enterprise XR is becoming recurring, mission-critical, and embedded in the workflows of industrial companies that cannot afford failure
The relevant macro drivers:
Virtualware is positioned in the mid-to-late mature use cases (industrial procedure, clinical simulation, vocational training) with growing exposure to multi-user collaboration via VIROO Room. It is not in compliance/onboarding (where Strivr et al dominate) nor in pure consumer entertainment.
- Industrial simulation software: ~$15-20B globally, low-double-digit CAGR
- Digital twin market: ~$15-25B by 2027 (some forecasters project $40B+ by 2030)
- Mature, slower-growing relative to enterprise XR, but with much larger absolute revenue
06From Bespoke Projects to Scalable SaaS+
Pre-2021, Virtualware was a bespoke VR projects shop — each engagement was a custom Statement of Work, scoped to a specific industrial customer's training need. Revenue was lumpy, gross margin was 70%-class (services-heavy with hardware pass-through), and operating leverage was limited. The 2021 2023 strategic plan launched VIROO as a platform product sold under a recurring annual subscription, with services as the bolt-on, not the lead. The company explicitly markets the model as VRaaS (Virtual Reality as a Service) or XRaaS.
The goss margin trajectory (70% → 90+% over four years) is the cleanest evidence — service-heavy revenue mixes don't produce 90%+ gross margin. The 19% EBITDA margin in 2024 demonstrated that the cost structure is capable of operating leverage; 2025 was a step back due to the +22.5% YoY personnel jump from Simumatik integration.
| SIGNAL | 2022 | 2023 | 2024 | 2025 |
|---|---|---|---|---|
| Subscription / VRaaS revenue | small | 1.0M est. | 1.73M | 1.95M |
| Subscription % of revenue | <30% | 35% | 41% | 45% |
| Gross margin | 70% | 74% | 86.8% | 93.7% |
| Active customer organisations | n/a | n/a | n/a | 120 |
| VIROO Rooms deployed worldwide | n/a | n/a | n/a | 64 |
| Floating licenses | n/a | n/a | n/a | 3000+ |
| EBITDA margin | adj-loss | 9% | 19% | 16% |
- No published ARR or NRR — without these we cannot directly observe net subscription growth excluding new bookings
- The 2024 → 2025 SaaS mix moved from 41% → 45%, not toward the 60%+ that “scaling SaaS” typically implies at this stage
- VIROO Rooms remain hardware-anchored — installation drives services revenue alongside subscription, diluting the pure-software ratio
- Bookings mix in 2025 was still 81% EMEA despite 2025 revenue mix being 51% non-EMEA — the geographic pivot lags the financial one
What “fully scaled” SaaS could look like for Virtualware - A reasonable steady state for a comparable European enterprise XR company over 3-5 years: - 65-75% subscription revenue - 90-95% gross margin (sustained) - 35–45% EBITDA margin (management's own 2027–2029 target, supported by: VIROO platform GM ~95%; services GM ~70%; Simumatik COGS effectively zero) - Net Revenue Retention >110% - ARR €15-30M (3-7x current run-rate) - Free cash flow conversion >50%
07Capitalisation of IP Development+
Roughly €500–600k per year of internal development cost is being capitalised rather than expensed. Management has confirmed that approximately 20% of total personnel cost is capitalised development, and that this capitalised element accounts for approximately 80% of the total expensed R&D charge. The amortisation period applied to VIROO and Simumatik intangibles is 10 years. Management does not expect either the capitalisation ratio or the amortisation period to change materially as the products mature.
Under Spanish GAAP / Plan General de Contabilidad (PGC), valuation rules 5 and 6 permit capitalisation of in-house development costs as intangible assets (“industrial property”) provided technical feasibility, intent and ability to use/sell, future economic benefit, available resources, and reliable cost measurement criteria are met – we believe that Auditors will rely on management guidance in this area. . This is broadly analogous to IAS 38 under IFRS, but applied less restrictively in practice. Capitalised intangibles are amortised over their useful life and tested for impairment annually
Capitalising development has three immediate effects:
1. Inflates EBITDA vs an expensed-R&D peer by the capitalised amount (~€500-600k annually)
2. Inflates intangible assets on the balance sheet
3. Creates future amortisation drag as capitalised assets are depreciated (current D&A €450-500k/yr)
The result is that today's capitalised R&D becomes tomorrow's amortisation. The system is broadly self financing — within ~10% of itself in steady state — but the timing creates non-cash optical headwinds in the income statement
Capitalisation of industrial property has been identified as a Key Audit Matter - in both the 2023 audit and the 2024 audit-capitalisation of IP is flagged. Specifically because: - The €3.32M intangible balance is concentrated on VIROO + Simumatik IP - VR/XR is a fast-moving stack — technological obsolescence is a real impairment trigger - Annual impairment testing depends on management forecasts of future exploitation.
We discussed this question with management regarding this risk and their response is that they assesses the impairment risk of intangible assets by considering both technical and commercial factors.
They asert that the assets associated with VIROO and Simumatik are amortised over a 10-year period, which is considered prudent in relation to their economic useful life. Despite the rapid evolution of the XR sector, our products are built on a modular and scalable technological architecture that enables continuous and incremental improvements, extending their useful life beyond a specific technology cycle. In addition they believe that the economic life of these assets is supported by multi-year customer contracts, which in some cases extend up to 6 years. These contracts provide strong revenue visibility and demonstrate the product's ability to generate recurring cash flows over prolonged periods.
Additionally, management tell us that they perform regular reviews of intangible assets, analysing potential impairment indicators such as disruptive technological changes, demand evolution, or deviations in commercial performance. To date, no indications have been identified that would suggest the need to recognise any impairment
08Fundamentally attractive · valuation+
Valuation is anchored on a revenue multiple approach. Using our forecast 2026 revenue of €6.04 mil and a 7× EV/Revenue multiples taken from peers (see table 11) implies an EV of ~€42m. Assuming minimal net debt and ~4.5m shares this yields a base-case value of ~€9.20 per share. To reflect liquidity constraints and execution risk typical of micro-caps, we apply a 20% discount, resulting in our target price of €7.42. BUY recommendation.
Rating rule: implied upside vs reference market price (€5.65, from PDF financials note “PEx (@ 5.65)”). Upside > 15% → BUY (green). Upside ≤ 15% → SELL (red). Headline initiation target price: €7.42 (BUY).
Small and lumpy revenue. At €4–6 mil revenue, one delayed project moves results. Cash flow can swing on receivables.
Platform transition still in progress . If clients keep buying bespoke projects instead of standardised deployments, scaling and margins lag the thesis.
Better funded competitors. Larger platforms can outspend on product, sales, and partnerships.
Platform and security. XR ecosystems change fast. Virtualware must stay current across devices, engines, and enterprise security requirements.
Budget cycles. Training and capex-linked deployments get deferred in downturns, even when ROI is clear
Intangible asset impairment - Material impairment would be triggered by: - Sustained deterioration in subscription revenue trend. Strategic pivot away from VIROO or Simumatik - Competitive displacement by hyperscaler XR platforms Loss of major reference customers (GVH, Spanish MoD, MEFPD) We assess the near-term impairment risk as low given the record 2025 bookings and active customer growth, as well as management assurances in terms of their regular review of the issue but it remains a tail risk worth tracking by investors
| Shares outstanding | 4,542,000 |
| Nominal value p.s. (Euro) | 0.035 |
| Issued capital | 158,970 |
| Unai Extremo % | 41.51 |
| Sergio Barrera % | 41.50 |
| Combined founder control % | 83.01 |
| Treasury shares | 175,000 |
| Implied free float % | 17.00 |
09Order book visibility helps support our positive view+
The 2025 CEO letter states “We have signed contracts worth over €8 million.” We believe this is significant and more than double the 2024 figure. The single largest contributor is the Spanish Ministry of Education who have signed the largest contract in Virtualware's history: over €5 million to deploy VIROO in 66 Centers of Excellence for Vocational Training. This contract alone is multi-year and will convert into revenue over several periods.
Virtualware's order book is composed of multi-year platform deployments (VIROO Rooms + infrastructure) which are large, lumpy, high-value contracts (e.g., GE Vernova, Spanish Ministry of Education). The XRaaS (subscription revenue) is recurring and grows steadily: 2024 XRaaS revenue: €1.73m, 2025 XRaaS revenue: €1.95m - This recurring base is part of the “embedded” order book.
Post-acquisition, Simumatik contributes industrial simulation and digital twin projects.
| YEAR | ORDER BOOK VALUE | COMMENTS |
|---|---|---|
| 2023 | €5.4m | Pre-IPO momentum |
| 2024 | €3.8m | Delayed deals; Q4 recovery (€1.5m) |
| 2025 | €8m+ | Record year; includes €5m+ Ministry of Education contract |
Forward-Looking Interpretation - The order book is now dominated by Large multi-year public sector deployments (Nuclear sector simulation contracts (GE Vernova, Hitachi) and Education sector rollouts (Spain, U.S. universities). Industrial simulation (Volvo, Gestamp, FILL) - This creates high revenue visibility for 2026–2028.
What This Means for a Forward Revenue Model - Management has provided the order book revenue recognition schedule, replacing our prior rule-of-thumb estimate of 40–60% year-1 recognition. The confirmed schedule is: 2026: €3,555,048; 2027: €1,845,859; 2028: €1,426,884; 2029: €913,584. This schedule, combined with XRaaS recurring revenue and new business, underpins the €5.7–6.0m guidance range. The MEFPD (Ministry of Education) contract alone contributes €831,600 per annum through to 2031. Implied 2026 revenue potential:
- Baseline 2025 revenue: €4.32m
- Order book conversion (conservative): €4–5m
- RaaS growth: €0.2–0.3m
- New business (run-rate): €1–2m
- Indicative 2026 revenue range: €6.0m – €7.5m
10Bull-case opportunities & bear-case risks+
Bull-case opportunities
Bear-case risks
11Peer valuation analysis (only 2 are listed)+
| COMPANY | TICKER | HQ | BUSINESS MODEL | EST. REVENUE P.A. | EV/REV | EV/EBITDA | GROWTH RATE | GROSS MARGIN | RELEVANCE TO VIRTUALWARE |
|---|---|---|---|---|---|---|---|---|---|
| Strivr | USA | VR training SaaS | ~$25–35m | 4–6× | n/a | 20–30% | 70–80% | High — enterprise VR training at scale | |
| Talespin | USA | XR learning platform | ~$10–15m | 5–7× | n/a | 25–35% | 75–85% | Medium — XR simulations, L&D | |
| Pixo VR | USA | Industrial VR training | ~$5–10m | 3–5× | n/a | 15–25% | 65–75% | High — industrial training overlap | |
| Simulanis | UK/India | XR training + digital twins | ~$8–12m | 3–4× | n/a | 20–30% | 60–70% | Very High — closest peer (XR + simulation) | |
| Kompanions | India | XR content & training | ~$5–8m | 2–3× | n/a | 15–20% | 55–65% | Medium — multi-industry XR training | |
| LineXero | UK | XR training simulations | ~$3–5m | 2–3× | n/a | 10–15% | 55–65% | Medium — multi-user XR scenarios | |
| PTC (Vuforia) | PTC | USA | AR enterprise platform | ~$100–150m (segment est.) | ~7× | ~20× | 10–15% | 75–80% | High — industrial AR workflows |
| Unity Industry | U | USA | RT3D platform | ~$350–450m (subset est.) | ~6× | n/a | 10–15% | 75–80% | High — RT3D platform competitor |
| Varjo | Finland | Enterprise XR hardware + cloud | ~$20–30m | 3–5× | n/a | 20–30% | 40–50% | Medium — high-end XR ecosystem |
12Appendix: Summary financials+
| 2023A | 2024A | 2025A | 2026E | 2027E | 2028E | 2029E | |
|---|---|---|---|---|---|---|---|
| Net turnover (Revenue) | 4.55 | 4.20 | 4.32 | 5.34 | 5.85 | 6.37 | 6.94 |
| In House work on assets | 0.53 | 0.44 | 0.60 | 0.00 | 0.00 | 0.00 | 0.00 |
| Cost of Goods Sold | -1.18 | -0.56 | -0.31 | -0.63 | -0.73 | -0.78 | -0.84 |
| Other operating income (incl. subsidies) | 0.42 | 0.48 | 0.54 | 0.55 | 0.60 | 0.73 | 0.73 |
| Personnel costs | -3.06 | -2.62 | -3.21 | -3.31 | -3.41 | -3.51 | -3.62 |
| Other operating expenses | -0.87 | -1.18 | -1.31 | -1.38 | -1.43 | -1.49 | -1.55 |
| Subsidies allocated to P&L | 0.00 | 0.00 | 0.05 | 0.00 | 0.00 | 0.00 | 0.00 |
| Other gains / (losses) | 0.04 | 0.04 | 0.00 | 0.00 | 0.00 | 0.00 | 0.00 |
| EBITDA | 0.43 | 0.81 | 0.67 | 0.56 | 0.88 | 1.32 | 1.66 |
| EBITDA margin | 9% | 19% | 16% | 11% | 15% | 21% | 24% |
| Depreciation & Amortisation | -0.27 | -0.26 | -0.46 | -0.42 | -0.46 | -0.49 | -0.53 |
| Operating profit (EBIT) | 0.15 | 0.55 | 0.22 | 0.14 | 0.42 | 0.82 | 1.13 |
| EBIT margin | 3% | 13% | 5% | 3% | 7% | 13% | 16% |
| Net financial income / (expense) | -0.10 | -0.01 | -0.40 | -0.09 | -0.09 | -0.09 | -0.09 |
| Share in profits (losses) of equity-accounted | 0.00 | 0.06 | 0.00 | 0.00 | 0.00 | 0.00 | 0.00 |
| Profit before tax | 0.05 | 0.60 | -0.18 | 0.05 | 0.32 | 0.73 | 1.03 |
| Income tax | -0.03 | -0.04 | -0.08 | 0.00 | 0.03 | 0.15 | 0.21 |
| Net profit from continuing operations | 0.02 | 0.55 | -0.26 | 0.05 | 0.36 | 0.87 | 1.24 |
| Consolidated net profit | 0.02 | 0.55 | -0.26 | 0.05 | 0.36 | 0.87 | 1.24 |
| Net margin | 0% | 13% | -6% | 1% | 6% | 14% | 18% |
| EPS (€) | 0.00 | 0.12 | -0.06 | 0.01 | 0.08 | 0.19 | 0.27 |
Balance Sheet
| 2023A | 2024A | 2025A | 2026E | 2027E | 2028E | 2029E | |
|---|---|---|---|---|---|---|---|
| ASSETS | |||||||
| Intangible assets (incl. capitalised dev, goo | 1.75 | 3.12 | 3.32 | 3.52 | 3.79 | 4.09 | 4.39 |
| Tangible assets | 0.17 | 0.04 | 0.06 | 0.09 | 0.12 | 0.15 | 0.16 |
| Equity-method holdings | 0.11 | 0.16 | 0.17 | 0.17 | 0.17 | 0.17 | 0.17 |
| LT financial investments | 0.04 | 0.05 | 0.05 | 0.05 | 0.05 | 0.05 | 0.05 |
| Deferred tax assets | 2.09 | 1.87 | 1.79 | 1.79 | 1.79 | 1.79 | 1.79 |
| Total non-current assets | 4.15 | 5.25 | 5.39 | 5.63 | 5.93 | 6.24 | 6.57 |
| Inventories | 0.06 | 0.03 | 0.00 | 0.05 | 0.06 | 0.06 | 0.07 |
| Trade & other receivables | 1.91 | 1.19 | 7.38 | 2.19 | 2.40 | 2.62 | 2.85 |
| Held for sale | 0.00 | 0.38 | 0.00 | 0.00 | 0.00 | 0.00 | 0.00 |
| Cash & ST investments / accruals | 0.30 | 0.68 | 0.50 | 0.97 | 0.57 | 0.65 | 1.09 |
| Other current assets | 0.32 | 0.79 | 0.41 | 0.41 | 0.41 | 0.41 | 0.41 |
| Total current assets | 2.60 | 3.07 | 8.29 | 3.63 | 3.44 | 3.75 | 4.42 |
| TOTAL ASSETS | 6.75 | 8.32 | 13.68 | 9.26 | 9.37 | 9.99 | 10.99 |
| EQUITY & LIABILITIES | |||||||
| Share capital | 0.16 | 0.16 | 0.16 | 0.16 | 0.16 | 0.16 | 0.16 |
| Reserves (incl. retained earnings) | 1.01 | 2.04 | 2.46 | 2.19 | 2.24 | 2.60 | 3.47 |
| Treasury shares | -0.04 | -0.01 | -0.13 | -0.13 | -0.13 | -0.13 | -0.13 |
| Subsidies in equity | 0.00 | 0.00 | 0.01 | 0.01 | 0.01 | 0.01 | 0.01 |
| Net P/L for the year | -0.00 | 0.19 | -0.26 | 0.05 | 0.36 | 0.87 | 1.24 |
| Non-controlling interests | 0.07 | 0.07 | 0.00 | 0.00 | 0.00 | 0.00 | 0.00 |
| Other equity / reclass adjustments | 0.00 | -0.00 | -0.03 | -0.03 | -0.03 | -0.03 | -0.03 |
| Total equity | 1.19 | 2.46 | 2.20 | 2.25 | 2.61 | 3.48 | 4.72 |
| LT debt (banks + other) | 1.17 | 0.79 | 0.74 | 0.74 | 0.74 | 0.74 | 0.74 |
| LT accruals (deferred grants/subsidies) | 1.01 | 1.16 | 4.14 | 1.33 | 1.46 | 1.59 | 1.73 |
| Deferred tax liabilities | 0.01 | 0.00 | 0.00 | 0.00 | 0.00 | 0.00 | 0.00 |
| Total non-current liabilities | 2.18 | 1.95 | 4.88 | 2.08 | 2.21 | 2.34 | 2.48 |
| ST debt (banks + other) | 1.28 | 1.27 | 2.46 | 1.96 | 1.46 | 0.96 | 0.46 |
| Trade & other payables | 0.22 | 0.14 | 0.32 | 0.16 | 0.18 | 0.19 | 0.21 |
| ST accruals | 0.93 | 1.31 | 2.08 | 1.07 | 1.17 | 1.27 | 1.39 |
| Held for sale (liab) | 0.00 | 0.31 | 0.00 | 0.00 | 0.00 | 0.00 | 0.00 |
| Other Payables | 0.94 | 0.89 | 1.75 | 1.75 | 1.75 | 1.75 | 1.75 |
| Total current liabilities | 3.37 | 3.92 | 6.60 | 4.93 | 4.55 | 4.17 | 3.80 |
| TOTAL EQUITY & LIABILITIES | 6.75 | 8.32 | 13.68 | 9.26 | 9.37 | 9.99 | 10.99 |
General Disclaimer
General disclaimer and remuneration model. European Equity Research Partners, S.L. (“EERP”) is an independent equity research firm domiciled in Spain and subject to European Union regulation. This report constitutes issuer-sponsored research. It has been commissioned by the issuer under analysis and prepared and published by EERP in consideration of a fee payable by the issuer under contract. That remuneration is not linked to the content, conclusions or direction of the research. EERP does not accept payment in securities, options or warrants. This report has been prepared in accordance with Regulation (EU) No 596/2014 (MAR) and Delegated Regulation (EU) 2016/958. EERP does not provide investment services requiring authorisation under MiFID II, investment banking services or personalised financial advice; any other service relationship with the issuer is governed and disclosed in accordance with EERP's Conflicts of Interest Policy.
Accuracy of content. All information used in this report has been compiled from publicly available sources that EERP believes to be reliable; however, its accuracy and completeness are not guaranteed and the information has not been independently verified. The opinions expressed are those of EERP's research department as at the date of publication. Forward-looking estimates and statements are based on assumptions and forecasts of future results and involve risks and uncertainties, so that actual results may differ materially from current expectations.
Exclusion of liability. To the fullest extent permitted by applicable law, and save in cases of wilful misconduct or gross negligence, EERP shall not be liable for any direct, indirect or consequential losses, loss of profits, damages, costs or expenses arising out of or in connection with the access to, use of or reliance on the information contained in this report.
No personalised advice. This report is for information purposes only and does not constitute investment advice or a personalised recommendation for any investor, nor an offer or solicitation to buy or sell securities. The value of investments may go down as well as up and past performance is no guarantee of future results. The securities mentioned may not be eligible for sale in all jurisdictions or to certain categories of investors.
Conflicts of interest and proprietary dealing. EERP maintains a restrictive policy on personal account dealing and conflicts of interest. EERP does not conduct investment business on its own account and does not hold proprietary positions in the securities under coverage. Its directors, employees and contractors may hold positions in those securities or in related securities, subject to EERP's internal policies. Full conflicts-of-interest disclosures and the applicable methodology are available at www.europeanequityresearch.com.
Independence of the research. The conclusions, recommendations and target prices are solely those of EERP: they are not negotiated with the issuer, are not conditioned on the commercial relationship or its direction, and are not approved or amended by the issuer prior to publication.
This report is directed at institutional and professional investors. Distribution in the following jurisdictions is subject to the conditions set out below.
Distribution restrictions. This report has been prepared under European Union law and is directed at institutional and professional investors within the European Union. It has not been prepared in accordance with the laws of any other jurisdiction, and EERP is not authorised or registered outside the European Union. Accordingly, this report is not prepared for, and is not for distribution to or use by, any person or entity in any jurisdiction where such distribution, publication or use would be contrary to local law or regulation, or would require any registration or authorisation that EERP does not hold — in particular the United States, the United Kingdom and Australia, among other jurisdictions. It is the responsibility of each recipient to inform themselves of, and to observe, any such restrictions.
www.europeanequityresearch.com
Copyright 2026 European Equity Research Partners, S.L. (EERP).